Survey Analysis Pipeline (MS Forms → Clean Data → Plots)
27 Dec 2025
This project is to document a pipeline for analyzing survey results end-to-end: ingesting raw exports, cleaning and restructuring responses, and producing report-ready visualizations (including diverging stacked bar charts for Likert-scale questions). This was inspired by a scenario where I had to analyze survey results exported from MS Forms. I wanted the workflow to be (1) repeatable, (2) auditable from raw data → final charts, and (3) easy to extend as questions, groups, and response options evolve. Through this project I’ve also tried to mature my project and code structure, as well as understand how to “collaborate” with LLMs like ChatGPT (in a sensible, non-vibe-coding sense).
Project highlights:
- Data analysis for survey data (multi-select parsing, metadata, tidy formats)
- Visualization design choices for categorical and Likert-scale responses
- Reproducible project structure (clean separation of
raw/,interim/,processed/, andfigures/) - “Human-readable analysis”: notebooks as documentation, with helper functions to keep code maintainable
Note: this notebook uses a dummy scenario + dummy data.
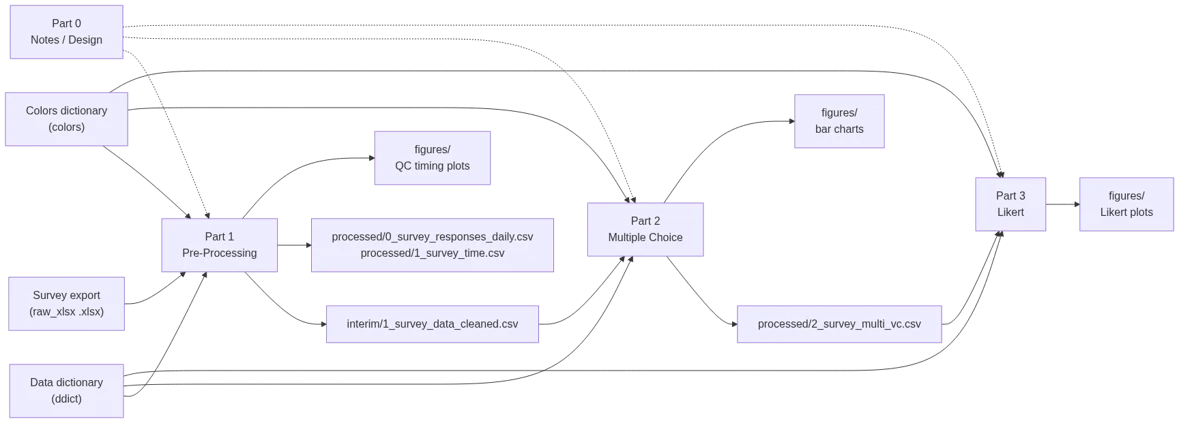
Series navigation: Part 0 (Notes) → Part 1 (Pre-Processing) → Part 2 (Multiple Choice Analysis & Bar Charts) → Part 3 (Likert-Scaled Visualizations)
Part 0 — Notes, References, and Design Decisions
This notebook is the “project notebook”: a place to capture the setup, references, and visualization ideas that influenced the implementation in later parts. I keep this separate on purpose so the processing/analysis notebooks stay focused and runnable, while this one holds the reasoning and breadcrumbs I’d want if I revisited the work months later.
In particular, it includes:
- Repro / environment notes (versions, repo structure, and how to run the notebooks)
- Visualization references for Likert-scale chart design (diverging stacked bars)
- A small interactive plotting scratchpad (used to sanity-check interactivity and layout mechanics before applying them to survey charts)
├── 2025-survey-pipeline-10-03.zip
├── data
│   ├── 0_raw
│   │   ├── msforms_dummy_survey_data_dictionary.csv
│   │   ├── msforms_dummy_survey.xlsx
│   │   └── survey_plot_color_dictionary.csv
│   ├── 1_interim
│   │   ├── 0_survey_raw_clean.csv
│   │   └── 1_survey_data_cleaned.csv
│   └── 2_processed
│       ├── 0_survey_responses_daily.csv
│       ├── 1_survey_time.csv
│       └── 2_survey_multi_vc.csv
├── figures
│   ├── \[lots of figures\]
├── Makefile
├── notebooks
│   ├── 2025-survey-pipeline-part0.ipynb
│   ├── 2025-survey-pipeline-part1.ipynb
│   ├── 2025-survey-pipeline-part2.ipynb
│   └── 2025-survey-pipeline-part3.ipynb
├── pyproject.toml
├── README.md
├── requirements.txt
├── src
│   └── survey_pipeline
│       ├── analysis_utils.py
│       └── __init__.py
├── tests
│   └── test_utils.py
Part 1 — Pre-Processing (Ingest + Clean + Restructure)
This notebook turns raw MS Forms exports into clean, analysis-ready datasets and runs some lightweight QC summaries. The main idea is traceability: keep the original export intact, apply minimal/explicit transforms, and write out interim artifacts that downstream analysis can rely on.
Overview:
- Load raw survey exports and the data dictionary (question metadata, response mappings, etc.)
- Normalize/clean a few common survey quirks (e.g., multi-select delimiter cleanup)
- Produce basic survey metadata plots (response timing, completion time) for quick QA
- Merge responses + metadata into a single cleaned dataset for analysis
Inputs
- Survey Data Export (
raw_xlsx): Mimics an MS Forms export (.xlsx) from a survey with mixed response types, including Likert-scaled questions. - Data dictionary (
ddict): Maps questions and responses to additional metadata - Colors dictionary (
colors): Maps question responses to colors for plotting
Primary outputs:
- Main cleaned dataset used downstream (
interim/1_survey_data_cleaned.csv) - Timing metadata (
processed/0_survey_responses_daily.csvandprocessed/1_survey_time.csv) - Figures saved under
figures/(e.g., responses-per-day, completion-time)
Part 2 — Multiple Choice Questions (Value Counts + Bar Charts)
This notebook focuses on categorical questions, especially multiple choice / multi-select responses. It generates results and bar charts that should make it easy to compare patterns across groups (e.g., org, role, experience level).
Overview:
- Load the cleaned survey dataset from Part 1
- Identify and normalize multi-select response fields (split, trim, standardize)
- Build value-count tables (overall + grouped) in a consistent long-form structure
- Generate bar charts / stacked bar charts for quick comparison across groups
- Write processed tables that downstream notebooks can reuse (especially Likert plotting)
Inputs:
- Cleaned survey dataset (
interim/1_survey_data_cleaned.csv): Output from Part 1 - Data dictionary (
ddict): Question metadata (types, labels, ordering, groupings) - Colors dictionary (
colors): Response → color mapping used for consistent plotting
Primary outputs:
- Multiple choice value-count table (
processed/2_survey_multi_vc.csv) - Figures saved under
figures/(bar charts / stacked bars by question and group)
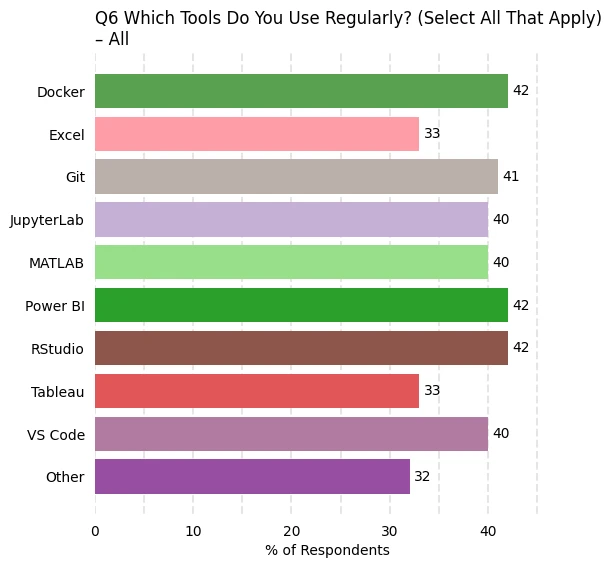
Example Plots
Below are example bar charts for questions 2 (expertise) and 6 (tool usage). The unique colors for each response are defined in the colors dictionary.
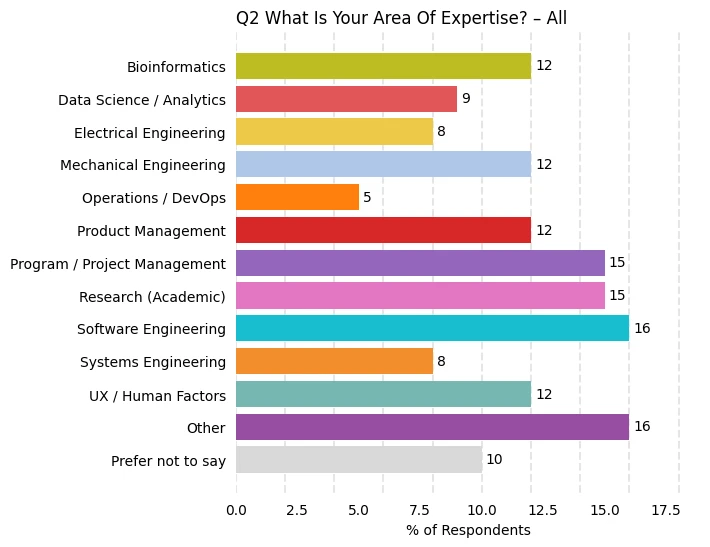
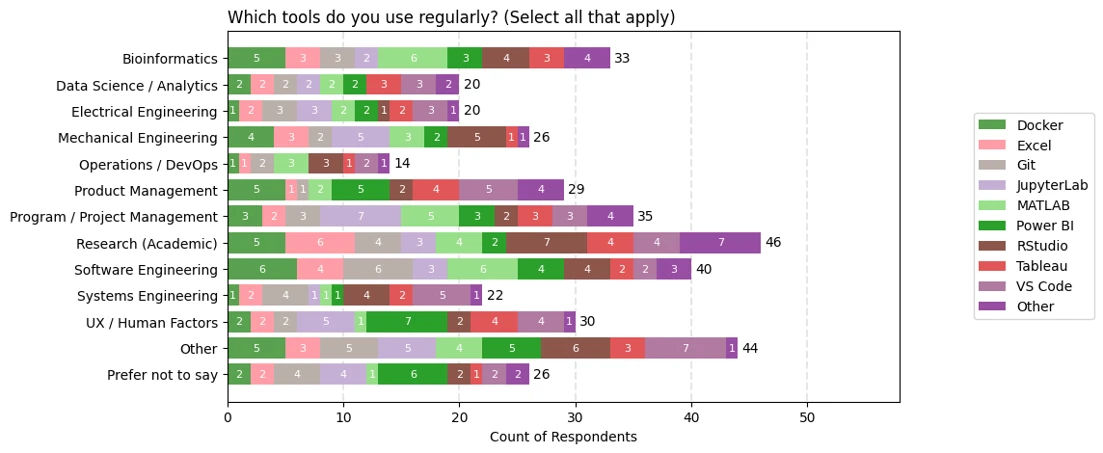
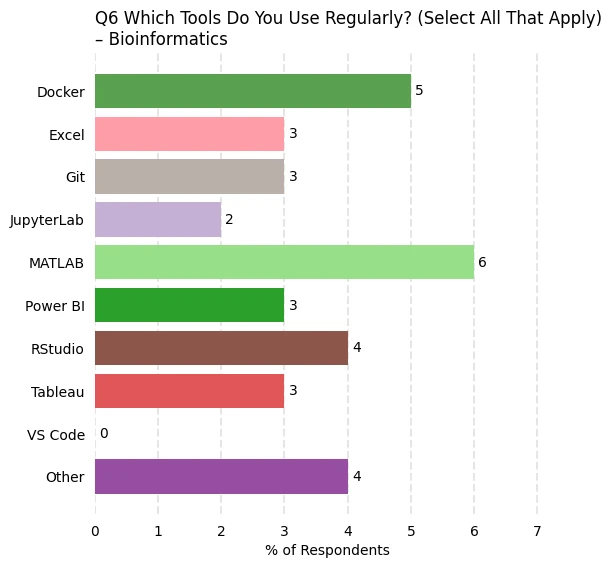
The above plots reflect all responses. Plots are also generated for various groupings. Below is a plot that reflect only those with bioinformatics expertise.
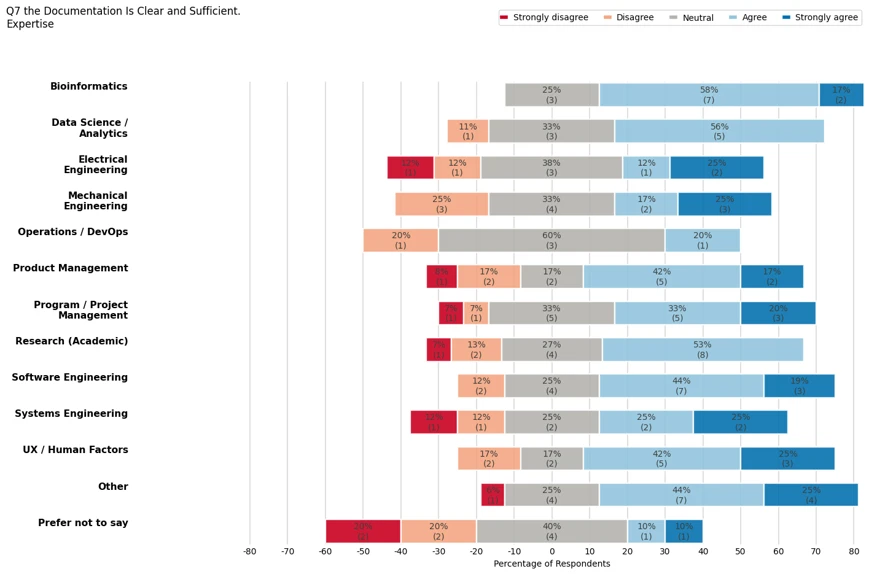
Part 3 — Likert-Scaled Questions (Diverging Stacked Bars)
This notebook produces the “headline” Likert visuals: diverging stacked bar charts that show the balance of agreement vs disagreement at a glance, and make it easy to compare groups. This notebook is also captures how to set up an interactive plot which allows for tuning figure layout, ordering, and labeling before finalization.
Overview:
- Load processed response counts from Part 2
- Filter/select the Likert-scaled question set and enforce consistent response ordering
- Convert counts → percentages (and optionally include sample sizes for context)
- Generate diverging stacked bar charts:
- “All questions” views for scanning patterns across a category
- Per-question plots for reporting, captions, and embedding on the website
- Save out final figures in a consistent naming scheme for reuse
Inputs:
- Multiple choice / Likert value-count table (
processed/2_survey_multi_vc.csv): Output from Part 2 - Data dictionary (
ddict): Defines which questions are Likert, response ordering, labels, and any grouping metadata - Colors dictionary (
colors): Response → color mapping for consistent Likert segment colors
Primary outputs:
- Likert figures saved under
figures/(all-question dashboards + per-question plots) - (Optional) additional processed summaries for reuse (e.g., percent tables / grouped Likert tables), depending on what you choose to persist
End of this pipeline. From here, figures and processed tables are ready for reporting or publishing.
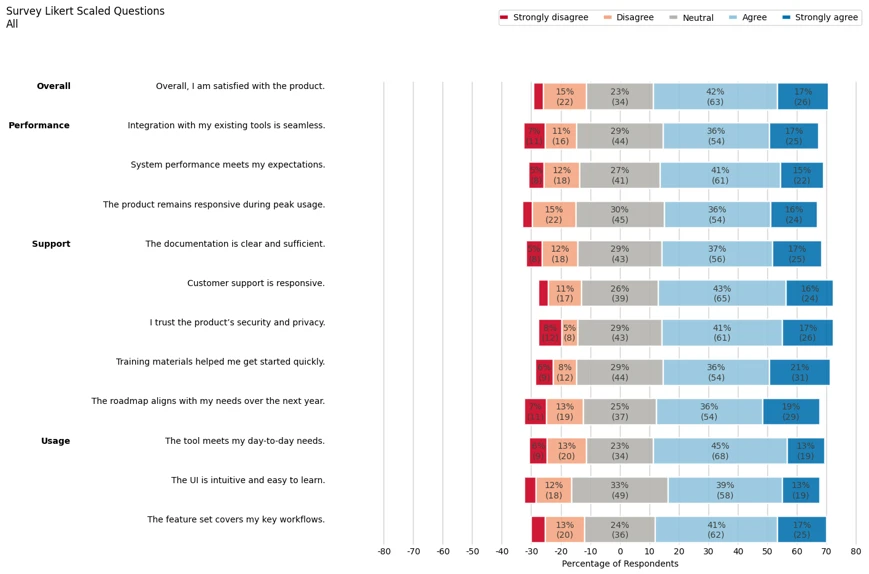
Example Plots
Below is the plot for all likert-scaled respones. Quesitons are grouped according to a category.
Plots are also generated by question. The figure below focuses only on question 7.