Snack Club 2023 Wrapped Data Analysis
04 Jan 2024
Intro

Snack Club is four friends getting together ~once a week to rate snacks. Think of it like a book club, but for snacks. This is the data analysis of snack scores given in 2023, in the spirit of the “wrapped” trend started by Spotify.
This project may not make a whole lot of sense to outsiders, but I wanted to share it because (1) I utilized my data analysis skills and (2) snacks are fun, right?
Some further context info:
- Members received a monthly box of snacks from the subscription service Snack Crate. Each box was themed around a country or culture.
- Snacks were rated in four categories: packaging, presentation, taste, and texture.
- The score range was 1-5. Some members strictly gave scores in 0.5 intervals, while others gave whatever score they felt like (e.g., 2.9).
- Drinks are considered snacks (why the hell not).
Analysis
Below is the Python code and some commentary for the analysis. In short, I took the snack review data, cleaned/prepared it, analyzed it in various ways (by member, snack, box/country, etc.), and generated visualizations (tables and plots). The two Python packages I used heavily are pandas and matplotlib.
Note: this was done in a JupyterLab notebook. The HTML version is here, which might look better but has less polish and commentary.
Code is on GitHub here.
Import Data
The data was originally input into a shared Google sheets workbook. I manually moved the data around and saved them into CSV files. From there I processed them with Python and pandas. This included some simple quality checks for missing values and correct data types.
import glob
data_files = glob.glob("./input/*.csv")
data_files
['./input/2023 data pre-processing - J.csv',
 './input/2023 data pre-processing - E.csv',
 './input/2023 data pre-processing - C.csv',
 './input/2023 data pre-processing - A.csv']
import pandas as pd
pd.set_option('display.precision', 2)

df_list = []
for fn in data_files:
    df = pd.read_csv(fn)
    df['Member'] = fn[-5]
    df_list.append(df)
df = pd.concat(df_list)
df['Date'] = pd.to_datetime(df['Date'], format='%m/%d/%Y')
df = df.sort_values(['Date', 'Country'])
df = df.set_index(['Date','Country','Snack','Member'])
# Identify missing scores
import numpy as np
print('Any null values?')
display(df[df.isna().any(axis=1)])
print('Any non-numeric values?')
display(df[~df.applymap(np.isreal).any(axis=1)])
Any null values?
| Packaging | Presentation | Taste | Texture | ||||
|---|---|---|---|---|---|---|---|
| Date | Country | Snack | Member |
Any non-numeric values?
| Packaging | Presentation | Taste | Texture | ||||
|---|---|---|---|---|---|---|---|
| Date | Country | Snack | Member |
Stats
The “overall score” is a mean of the four score categories assigned to each snack (packaging, presentation, taste, texture).
# Overall Score
df['Overall Score'] = df.mean(axis=1)
df.to_csv('2023_snack_club_scores.csv')
Overall Statistics
Present a few simple overall metrics, like number of snacks rated and total scores given.
# Stats overall
print('2023 Snack Club Statistics!')
print('Snacks rated:', df.reset_index()['Snack'].value_counts().count())
print('Countries / snack crates #:', df.reset_index()['Country'].value_counts().count())
print('Countries / snack crates:', df.reset_index()['Country'].value_counts().index.values)
print('Snack scores, total given:', df.count().sum())
2023 Snack Club Statistics!
Snacks rated: 147
Countries / snack crates #: 14
Countries / snack crates: ['Thailand' 'Colombia' 'United Kingdom' 'Italy' 'Greece' 'Belgium'
 'Ireland' 'India' 'China' 'Korea' 'Spain' 'Canada'
 'America-Vegas-Special' 'Caribbean']
Snack scores, total given: 2940
By Member
Looking at the scores by member. The types of questions trying to answer here include “who gave the highest/lowest scores” and “who was the harshest critic in the taste category”.
# display(df.agg(['idxmax','idxmin']))
idx = pd.IndexSlice
# Stats Members
display('*************************************')
display('Stats by Member')
df_stats_members = df.groupby(['Member']).agg(['min','max','mean','median','std','idxmax','idxmin'])
display(df_stats_members.loc[:, idx[:, ['min','max']]])
display(df_stats_members.loc[:, idx[:, ['mean','median','std']]])
# display(df_stats_members.loc[:, idx[:, ['idxmax','idxmin']]])
display(df_stats_members.loc[:, idx[:, ['mean']]].agg(['idxmax','idxmin']))
display(df_stats_members.loc[:, idx[:, ['std']]].agg(['idxmax','idxmin']))
'*************************************'


'Stats by Member'
| Packaging | Presentation | Taste | Texture | Overall Score | ||||||
|---|---|---|---|---|---|---|---|---|---|---|
| min | max | min | max | min | max | min | max | min | max | |
| Member | ||||||||||
| A | 1.75 | 5.0 | 1.5 | 4.8 | 1.5 | 4.75 | 1.0 | 5.0 | 1.75 | 4.55 |
| C | 1.50 | 5.0 | 1.5 | 5.0 | 1.0 | 4.50 | 1.0 | 5.0 | 1.88 | 4.50 |
| E | 1.50 | 5.0 | 1.0 | 5.0 | 1.2 | 5.00 | 1.0 | 4.7 | 1.62 | 4.45 |
| J | 1.50 | 5.0 | 1.0 | 5.0 | 1.0 | 5.00 | 1.0 | 5.0 | 1.50 | 4.62 |
| Packaging | Presentation | Taste | Texture | Overall Score | |||||||||||
|---|---|---|---|---|---|---|---|---|---|---|---|---|---|---|---|
| mean | median | std | mean | median | std | mean | median | std | mean | median | std | mean | median | std | |
| Member | |||||||||||||||
| A | 3.32 | 3.4 | 0.79 | 3.16 | 3.0 | 0.73 | 3.55 | 3.75 | 0.74 | 3.38 | 3.5 | 0.82 | 3.35 | 3.38 | 0.53 |
| C | 3.47 | 3.5 | 0.73 | 3.31 | 3.5 | 0.73 | 3.48 | 3.50 | 0.78 | 3.52 | 3.5 | 0.78 | 3.44 | 3.50 | 0.50 |
| E | 3.26 | 3.3 | 0.73 | 2.96 | 3.0 | 0.88 | 3.37 | 3.50 | 0.83 | 3.24 | 3.4 | 0.84 | 3.21 | 3.25 | 0.56 |
| J | 3.18 | 3.0 | 0.84 | 3.12 | 3.0 | 0.79 | 3.14 | 3.00 | 0.92 | 3.28 | 3.5 | 0.81 | 3.18 | 3.25 | 0.56 |
| Packaging | Presentation | Taste | Texture | Overall Score | |
|---|---|---|---|---|---|
| mean | mean | mean | mean | mean | |
| idxmax | C | C | A | C | C |
| idxmin | J | E | J | E | J |
| Packaging | Presentation | Taste | Texture | Overall Score | |
|---|---|---|---|---|---|
| std | std | std | std | std | |
| idxmax | J | E | J | E | J |
| idxmin | E | C | A | C | C |
By Snack
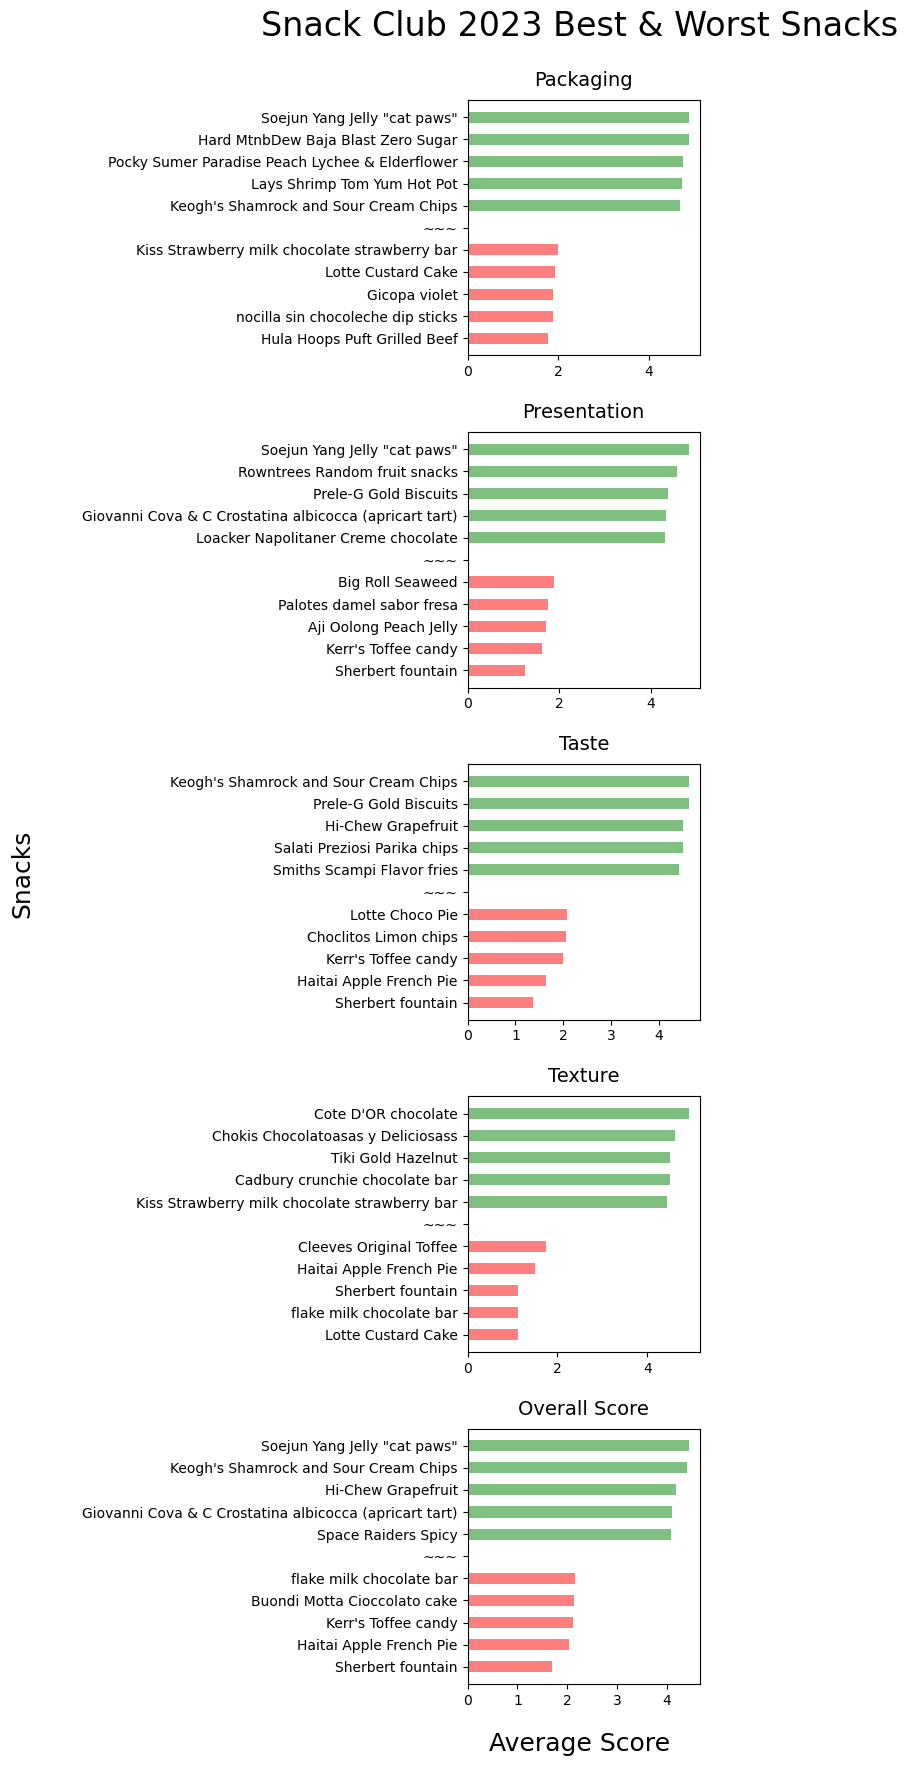
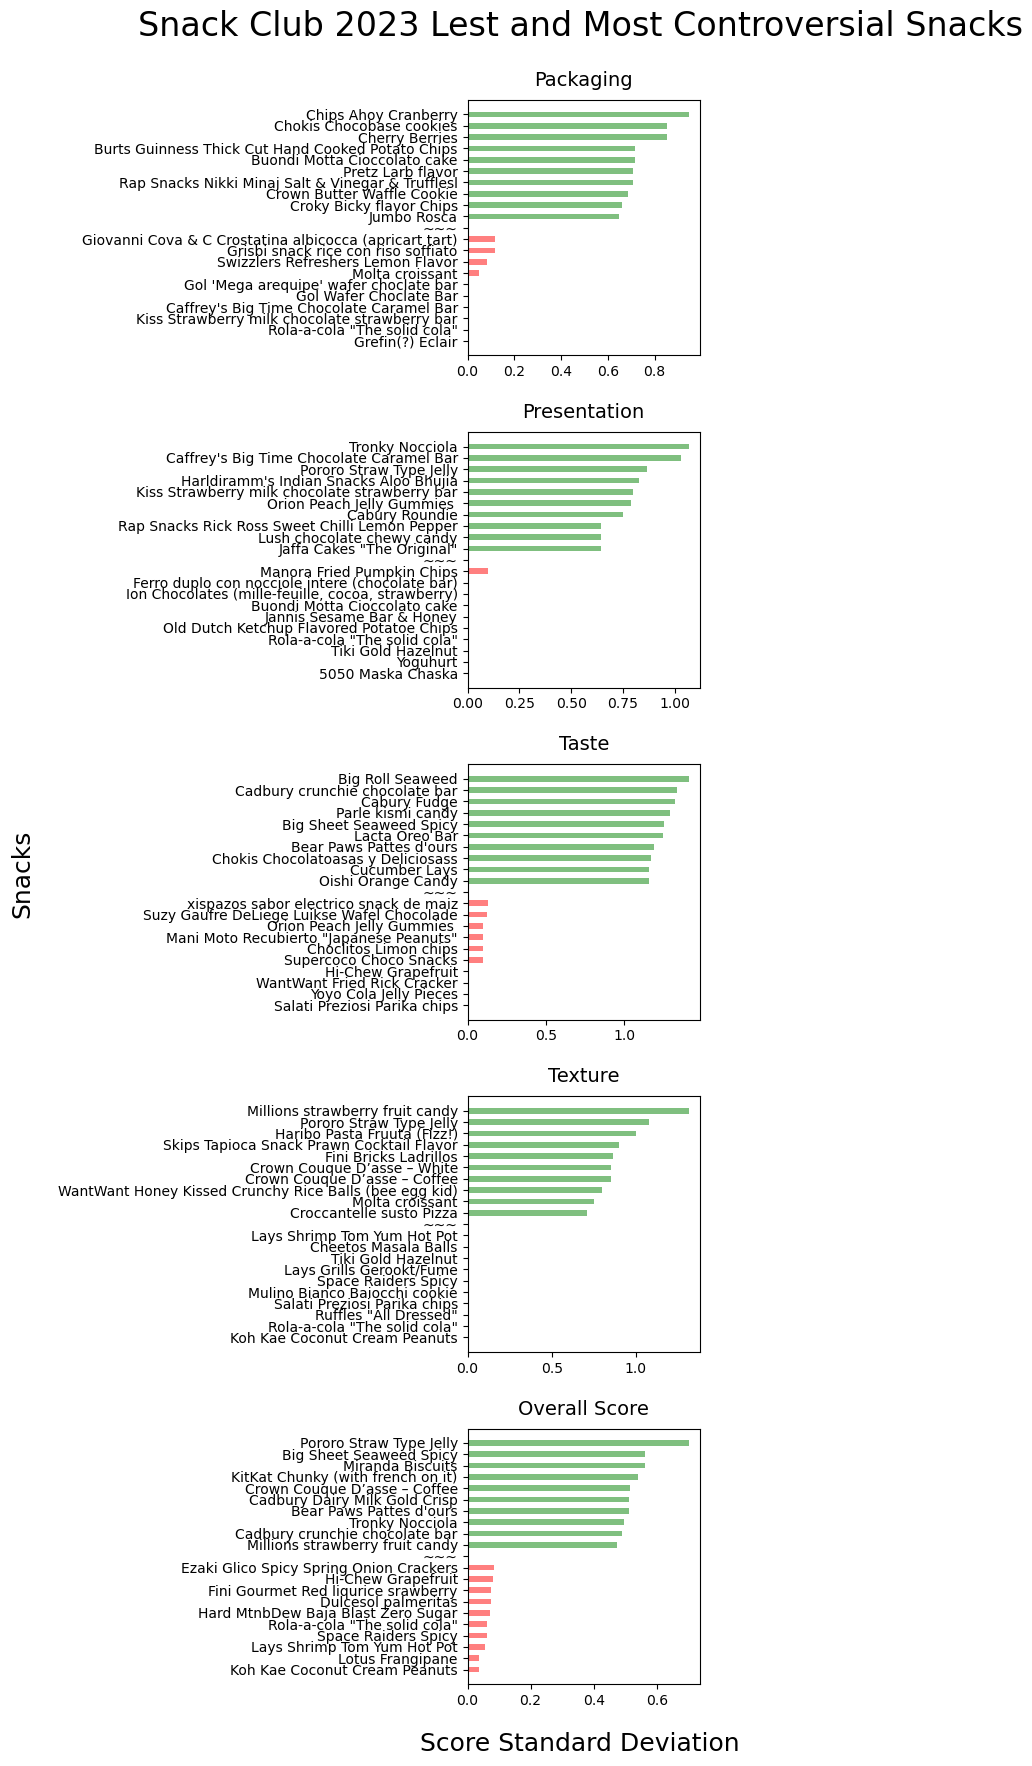
Moving onto looking at snack scores by… snack. This is to answer the all important question of which are the best and worst snacks. This is done with a simple mean of the member score categories and the overall score. Looking at the standard deviation, we can also get a sense of which snacks are the most “controversial”. For example, Keogh’s Shamrock and Sour Cream Chips was the best tasting snack across all members, while the Big Roll Seaweed had the highest standard deviation, a reflection of how it was either liked a lot or not at all.
Top snacks by category, overall
# # Stats Snacks
display('Stats by Snack')
df_stats_snacks = df.groupby(['Snack']).agg(['min','max','mean','median','std'])
idx = pd.IndexSlice
df_ss_mean = df_stats_snacks.loc[:, idx[:, ['mean']]].droplevel(level=1,axis='columns').sort_values(by=['Taste','Overall Score','Texture'],ascending=False)
display(df_ss_mean)
display('*************************************')
df_ss_mm = df_stats_snacks.loc[:, idx[:, ['mean','median','std']]]
display(df_ss_mm.agg(['idxmax','idxmin'])) # only returns first instance
'Stats by Snack'
| Packaging | Presentation | Taste | Texture | Overall Score | |
|---|---|---|---|---|---|
| Snack | |||||
| Keogh's Shamrock and Sour Cream Chips | 4.69 | 4.20 | 4.62 | 4.05 | 4.39 |
| Prele-G Gold Biscuits | 2.25 | 4.38 | 4.62 | 4.00 | 3.81 |
| Hi-Chew Grapefruit | 4.40 | 3.70 | 4.50 | 4.14 | 4.18 |
| Salati Preziosi Parika chips | 3.92 | 3.25 | 4.50 | 3.50 | 3.79 |
| Smiths Scampi Flavor fries | 2.75 | 4.06 | 4.42 | 4.00 | 3.81 |
| ... | ... | ... | ... | ... | ... |
| Lotte Choco Pie | 2.42 | 2.75 | 2.08 | 2.05 | 2.33 |
| Choclitos Limon chips | 2.75 | 3.20 | 2.05 | 3.38 | 2.84 |
| Kerr's Toffee candy | 3.00 | 1.62 | 2.00 | 1.82 | 2.11 |
| Haitai Apple French Pie | 3.12 | 1.88 | 1.64 | 1.50 | 2.03 |
| Sherbert fountain | 3.00 | 1.25 | 1.38 | 1.12 | 1.69 |
147 rows × 5 columns
'*************************************'
| Packaging | Presentation | Taste | Texture | Overall Score | |||||||||||
|---|---|---|---|---|---|---|---|---|---|---|---|---|---|---|---|
| mean | median | std | mean | median | std | mean | median | std | mean | median | std | mean | median | std | |
| idxmax | Hard MtnbDew Baja Blast Zero Sugar | Hard MtnbDew Baja Blast Zero Sugar | Chips Ahoy Cranberry | Soejun Yang Jelly "cat paws" | Soejun Yang Jelly "cat paws" | Tronky Nocciola | Keogh's Shamrock and Sour Cream Chips | Keogh's Shamrock and Sour Cream Chips | Big Roll Seaweed | Cote D'OR chocolate | Cote D'OR chocolate | Millions strawberry fruit candy | Soejun Yang Jelly "cat paws" | Soejun Yang Jelly "cat paws" | Pororo Straw Type Jelly |
| idxmin | Hula Hoops Puft Grilled Beef | Hula Hoops Puft Grilled Beef | Caffrey's Big Time Chocolate Caramel Bar | Sherbert fountain | Sherbert fountain | 5050 Maska Chaska | Sherbert fountain | Sherbert fountain | Hi-Chew Grapefruit | Lotte Custard Cake | Lotte Custard Cake | Bear Paws Pattes d'ours | Sherbert fountain | Sherbert fountain | Koh Kae Coconut Cream Peanuts |
Plots of Best Snacks by Average Member Score & Category
Plot the best/worst 5 snacks by the categories.
import matplotlib.pyplot as plt

df_mean = df_stats_snacks.loc[:, idx[:, ['mean']]]
df_mean.columns = df_mean.columns.droplevel(1)

fig, axs = plt.subplots(5,1,figsize=(3,18))
keys = [x for x in df_mean.columns] # preserves order
targets = zip(keys, axs.flatten())
fig.suptitle('Snack Club 2023 Best & Worst Snacks', fontsize=24)
fig.supylabel('Snacks',x=-1.4,ha='left', fontsize=18)
fig.supxlabel('Average Score', fontsize=18)
colors = {'Packaging':'blue',
          'Presentation':'green',
          'Taste':'red',
          'Texture':'purple',
         'Overall Score': 'cyan'}
by_label = {}
for i, (key, ax) in enumerate(targets):
    df_topfive = df_mean[key].sort_values(ascending=False)[0:5].sort_values()
    df_lowfive = df_mean[key].sort_values()[0:5].sort_values()
    df_low_top = pd.concat([df_topfive, pd.Series(['~',0]), df_lowfive])

    ax.set_title(f"{key}", fontsize=14,pad=10)

    snacks = df_lowfive.index.values
    scores = df_lowfive.values
    color = 'red'
    ax.barh(snacks, scores,
           color=color,label=key,
           alpha=.5,height=0.5)

    ax.barh(['~~~'], [0],height=0.0)

    snacks = df_topfive.index.values
    scores = df_topfive.values
    color = 'green'
    ax.barh(snacks, scores,
           color=color,label=key,
           alpha=.5,height=0.5)
fig.align_labels()
fig.subplots_adjust(top=0.93,bottom=0.05,hspace = 0.3, wspace = 0.1)
fig.savefig(f'plots/sc_bestworst_snack_avg.png',bbox_inches='tight')
Plots of Snack Standard Deviation Scores by Member Score & Category
Plot the best/worst 5 snacks by standard deviation, again a measure of how “controversial” or not the snack was. Note how in multiple cases all the same scores were assigned for a snack and so the standard deviation was 0. This is especially seen in the texture category.
import matplotlib.pyplot as plt

df_std = df_stats_snacks.loc[:, idx[:, ['std']]]
df_std.columns = df_std.columns.droplevel(1)

fig, axs = plt.subplots(5,1,figsize=(3,18))
keys = [x for x in df_std.columns] # preserves order
targets = zip(keys, axs.flatten())
fig.suptitle('Snack Club 2023 Lest and Most Controversial Snacks', fontsize=24)
fig.supylabel('Snacks',x=-1.4,ha='left', fontsize=18)
fig.supxlabel('Score Standard Deviation', fontsize=18)
colors = {'Packaging':'blue',
          'Presentation':'green',
          'Taste':'red',
          'Texture':'purple',
         'Overall Score': 'cyan'}
by_label = {}
for i, (key, ax) in enumerate(targets):
    df_topfive = df_std[key].sort_values(ascending=False)[0:10].sort_values()
    df_lowfive = df_std[key].sort_values()[0:10].sort_values()
    df_low_top = pd.concat([df_topfive, pd.Series(['~',0]), df_lowfive])

    ax.set_title(f"{key}", fontsize=14,pad=10)

    snacks = df_lowfive.index.values
    scores = df_lowfive.values
    color = 'red'
    ax.barh(snacks, scores,
           color=color,label=key,
           alpha=.5,height=0.5)

    ax.barh(['~~~'], [0],height=0.0)

    snacks = df_topfive.index.values
    scores = df_topfive.values
    color = 'green'
    ax.barh(snacks, scores,
           color=color,label=key,
           alpha=.5,height=0.5)
fig.align_labels()
fig.subplots_adjust(top=0.93,bottom=0.05,hspace = 0.3, wspace = 0.1)
fig.savefig(f'plots/sc_bestworst_snack_std.png',bbox_inches='tight')
Plots, Best Snacks by Member & Category
For each member, create a plot of their best/worst snacks in each category. Save the plots as pictures because they are so large.
df_stacked = df.stack().reset_index().rename(columns={'level_4':'Category',
                                        0 : 'Score'})
df_stacked = df_stacked.set_index(['Date','Country','Snack',
                                  'Member','Category'])

grouped = df_stacked.groupby(['Member','Category'],sort=False)
keys = [x for (x,y) in grouped] # preserves order
members = [k[0] for k in keys]
# categories = [k[1] for k in keys]
categories = ['Overall Score','Taste','Texture','Presentation','Packaging']

for i, memb in enumerate(members):
    fig, axs = plt.subplots(5,1,figsize=(4,24))
    targets = zip(categories, axs.flatten())
    fig.suptitle(f'Snack Club 2023 Best & Worst Snacks - Member {memb}', fontsize=24)
    fig.supylabel('Snacks',x=-0.3,ha='left', fontsize=18)
    fig.supxlabel('Score', fontsize=18)
    by_label = {}
    for j, (cat,ax) in enumerate(targets):
        idx = pd.IndexSlice
        df_f = df_stacked.loc[idx[:, :, :, memb, cat]]
        df_top = df_f['Score'].sort_values(ascending=False)[0:10].sort_values()
        df_low = df_f['Score'].sort_values()[0:10].sort_values()
        # df_low_top = pd.concat([df_top, pd.Series(['~',0]), df_low])
        # display(df_low_top)
        ax.set_title(f"{memb} - {cat}", fontsize=14,pad=10)
        snacks = [x[2] for x in df_low.index.values]
        scores = df_low.values
        color = 'red'
        ax.barh(snacks, scores,
               color=color,label=cat,
               alpha=.5,height=0.6)

        ax.barh(['~~~'], [0],height=0.0)

        snacks = [x[2] for x in df_top.index.values]
        scores = df_top.values
        color = 'green'
        ax.barh(snacks, scores,
               color=color,label=cat,
               alpha=.5,height=0.5)
        ax.set_xticks([1,2,3,4,5])
    fig.subplots_adjust(top=0.93,bottom=0.05,hspace = 0.3, wspace = 0.2)
    fig.savefig(f'plots/sc_bestworst_snack_{memb}.png',bbox_inches='tight')
    plt.close(fig)
By Country/Crate
Every snack is associated with a country/culture theme per Snack Crate. In addition, there’s a bonus “Las Vegas” category for snacks rated while on a trip to Las Vegas. Look at snack scores by these countries/cultures, see which ones had best/worst scores, etc.
# # Stats Country

display('*************************************')
display('Stats by Country')
df_stats_country = df.groupby(['Country']).agg(['min','max','mean','median','std'])
idx = pd.IndexSlice
# display(df_stacked.droplevel(['Member','Category','Date']).reset_index().drop(columns='Score').set_index())
df_sc = df_stats_country.loc[:, idx[:, ['mean','std']]].copy()
# better way to get count of countries? lol
c_count = df_stacked.reset_index()[['Country','Snack']].drop_duplicates().set_index(['Country']).groupby(['Country']).agg(['count'])
# df_sc[('','count')] = c_count
df_sc = pd.concat([df_sc,c_count], axis=1)

display(df_sc.sort_values(by=('Taste','mean'),ascending=False))
display(df_sc.agg(['idxmax','idxmin']))
'*************************************'


'Stats by Country'
| Packaging | Presentation | Taste | Texture | Overall Score | Snack | ||||||
|---|---|---|---|---|---|---|---|---|---|---|---|
| mean | std | mean | std | mean | std | mean | std | mean | std | count | |
| Country | |||||||||||
| Caribbean | 3.18 | 0.73 | 2.82 | 0.42 | 3.73 | 0.56 | 3.72 | 0.58 | 3.36 | 0.33 | 4 |
| Thailand | 3.60 | 0.75 | 2.86 | 0.59 | 3.56 | 0.89 | 3.42 | 0.70 | 3.36 | 0.46 | 16 |
| Belgium | 2.89 | 0.75 | 3.42 | 0.58 | 3.54 | 0.80 | 3.62 | 0.81 | 3.37 | 0.46 | 11 |
| China | 3.89 | 0.57 | 3.29 | 0.85 | 3.51 | 0.76 | 3.40 | 0.79 | 3.52 | 0.54 | 11 |
| America-Vegas-Special | 3.81 | 0.85 | 3.75 | 0.48 | 3.46 | 0.80 | 3.59 | 0.38 | 3.65 | 0.30 | 4 |
| Ireland | 3.45 | 0.78 | 3.15 | 0.79 | 3.45 | 0.89 | 3.35 | 0.78 | 3.35 | 0.61 | 11 |
| Italy | 3.12 | 0.59 | 3.25 | 0.96 | 3.43 | 0.69 | 3.45 | 0.85 | 3.31 | 0.64 | 12 |
| Spain | 2.83 | 0.78 | 3.07 | 0.68 | 3.39 | 0.75 | 3.49 | 0.68 | 3.19 | 0.52 | 10 |
| India | 3.11 | 0.79 | 2.94 | 0.81 | 3.38 | 0.91 | 3.31 | 0.39 | 3.19 | 0.38 | 11 |
| Canada | 3.33 | 0.72 | 3.39 | 0.90 | 3.36 | 0.93 | 3.22 | 0.87 | 3.33 | 0.64 | 9 |
| Colombia | 3.26 | 0.60 | 2.96 | 0.56 | 3.34 | 0.69 | 3.35 | 0.78 | 3.23 | 0.40 | 14 |
| Greece | 3.18 | 0.77 | 3.46 | 0.56 | 3.26 | 0.84 | 3.42 | 0.67 | 3.33 | 0.41 | 12 |
| Korea | 3.40 | 0.89 | 3.02 | 1.01 | 3.22 | 0.86 | 2.83 | 1.11 | 3.12 | 0.78 | 10 |
| United Kingdom | 3.33 | 0.77 | 2.91 | 1.00 | 2.94 | 0.95 | 3.07 | 1.15 | 3.06 | 0.71 | 12 |
| Packaging | Presentation | Taste | Texture | Overall Score | Snack | ||||||
|---|---|---|---|---|---|---|---|---|---|---|---|
| mean | std | mean | std | mean | std | mean | std | mean | std | count | |
| idxmax | China | Korea | America-Vegas-Special | Korea | Caribbean | United Kingdom | Caribbean | United Kingdom | America-Vegas-Special | Korea | Thailand |
| idxmin | Spain | China | Caribbean | Caribbean | United Kingdom | Caribbean | Korea | America-Vegas-Special | United Kingdom | America-Vegas-Special | America-Vegas-Special |
Best/West Snack in Country/Crate
df_stats_cs = df.groupby(['Country','Snack']).agg(['mean'])
idx = pd.IndexSlice
df_scs = df_stats_cs.loc[:, idx[:, ['mean']]]
display('Best Snacks By Country (Average Score)')
display(df_scs.groupby('Country').agg(['idxmax']).applymap(lambda x: x[1]).droplevel(axis='columns',level=[2,1]))
display('Worst Snacks By Country (Average Score)')
display(df_scs.groupby('Country').agg(['idxmin']).applymap(lambda x: x[1]).droplevel(axis='columns',level=[2,1]))
'Best Snacks By Country (Average Score)'
| Packaging | Presentation | Taste | Texture | Overall Score | |
|---|---|---|---|---|---|
| Country | |||||
| America-Vegas-Special | Hard MtnbDew Baja Blast Zero Sugar | Hard MtnbDew Baja Blast Zero Sugar | Rap Snacks Nikki Minaj Salt & Vinegar & Trufflesl | Rap Snacks Lily Baby "All In" Flavor Salt & Vi... | Hard MtnbDew Baja Blast Zero Sugar |
| Belgium | Lotus Biscoff with Belgium Choclate | Cote D'OR chocolate | Cote D'OR chocolate | Cote D'OR chocolate | Cote D'OR chocolate |
| Canada | Old Dutch Ketchup Flavored Potatoe Chips | KitKat Chunky (with french on it) | Humpty Dumpty Ringolos BBQ Flavor | Ruffles "All Dressed" | Humpty Dumpty Ringolos BBQ Flavor |
| Caribbean | Ole Xtreme Rranch Tortilla Chips | Ole Xtreme Rranch Tortilla Chips | Tiki Gold Hazelnut | Tiki Gold Hazelnut | Tiki Gold Hazelnut |
| China | Orion Peach Jelly Gummies | WantWant Honey Kissed Crunchy Rice Balls (bee ... | Hi-Chew Grapefruit | Chips Ahoy Cranberry | Hi-Chew Grapefruit |
| Colombia | Jumbo Flow | Jumbo Rosca | Supercoco Choco Snacks | Chokis Chocolatoasas y Deliciosass | Jumbo Flow |
| Greece | Derby Caramel Bar | Jumbo Vrikoles, cheese and tomoato | Kiss Strawberry milk chocolate strawberry bar | Kiss Strawberry milk chocolate strawberry bar | Derby Caramel Bar |
| India | Waffy vanilla wafers | Prele-G Gold Biscuits | Prele-G Gold Biscuits | Prele-G Gold Biscuits | Prele-G Gold Biscuits |
| Ireland | Keogh's Shamrock and Sour Cream Chips | Keogh's Shamrock and Sour Cream Chips | Keogh's Shamrock and Sour Cream Chips | Keogh's Shamrock and Sour Cream Chips | Keogh's Shamrock and Sour Cream Chips |
| Italy | Salati Preziosi Parika chips | Giovanni Cova & C Crostatina albicocca (aprica... | Salati Preziosi Parika chips | Giovanni Cova & C Crostatina albicocca (aprica... | Giovanni Cova & C Crostatina albicocca (aprica... |
| Korea | Soejun Yang Jelly "cat paws" | Soejun Yang Jelly "cat paws" | Soejun Yang Jelly "cat paws" | Soejun Yang Jelly "cat paws" | Soejun Yang Jelly "cat paws" |
| Spain | el Valle Sabor Huevo Frito Fried Egg Taste | Dulcesol palmeritas | Dulcesol palmeritas | Dulcesol palmeritas | el Valle Sabor Huevo Frito Fried Egg Taste |
| Thailand | Pocky Sumer Paradise Peach Lychee & Elderflower | Jack & Jill Cocont Crackers | Manora Fried Pumpkin Chips | Jack & Jill Cocont Crackers | Jack & Jill Cocont Crackers |
| United Kingdom | Jaffa Cakes "The Original" | Rowntrees Random fruit snacks | Space Raiders Spicy | Cadbury crunchie chocolate bar | Space Raiders Spicy |
'Worst Snacks By Country (Average Score)'
| Packaging | Presentation | Taste | Texture | Overall Score | |
|---|---|---|---|---|---|
| Country | |||||
| America-Vegas-Special | Rap Snacks Nikki Minaj Salt & Vinegar & Trufflesl | Rap Snacks Lily Baby "All In" Flavor Salt & Vi... | Rap Snacks Lily Baby "All In" Flavor Salt & Vi... | Hard MtnbDew Baja Blast Zero Sugar | Rap Snacks Lily Baby "All In" Flavor Salt & Vi... |
| Belgium | Gicopa violet | Grefin(?) Eclair | DeliChoc Choco'Bar | DeliChoc Choco'Bar | DeliChoc Choco'Bar |
| Canada | Coffee Crisp Double Double Chocolate Bar | Kerr's Toffee candy | Kerr's Toffee candy | Kerr's Toffee candy | Kerr's Toffee candy |
| Caribbean | Tiki Gold Hazelnut | Jamaican Choice Spice Bun | Ole Xtreme Rranch Tortilla Chips | Cherry Berries | Jamaican Choice Spice Bun |
| China | Oishi Orange Candy | Aji Oolong Peach Jelly | Oreo Oolong + Peach | Aji Oolong Peach Jelly | Aji Oolong Peach Jelly |
| Colombia | Chokis Chocolatoasas y Deliciosass | Chokis Chocobase cookies | Choclitos Limon chips | Colombina Coffee Delight chewy candy | Choclitos Limon chips |
| Greece | Kiss Strawberry milk chocolate strawberry bar | Derby Caramel Bar | Keraso Pitaki cherry pie | Keraso Pitaki cherry pie | Keraso Pitaki cherry pie |
| India | 5050 Maska Chaska | Rola-a-cola "The solid cola" | Treat Burst Choco Fills | Cheetos Masala Balls | Treat Burst Choco Fills |
| Ireland | Cadbury Snack! shortcake | Burts Guinness Thick Cut Hand Cooked Potato Chips | Caffrey's Big Time Chocolate Caramel Bar | Cleeves Original Toffee | Cleeves Original Toffee |
| Italy | Buondi Motta Cioccolato cake | Buondi Motta Cioccolato cake | Buondi Motta Cioccolato cake | Buondi Motta Cioccolato cake | Buondi Motta Cioccolato cake |
| Korea | Lotte Custard Cake | Haitai Apple French Pie | Haitai Apple French Pie | Lotte Custard Cake | Haitai Apple French Pie |
| Spain | nocilla sin chocoleche dip sticks | Palotes damel sabor fresa | Fini Gourmet Red liqurice srawberry | Fini Gourmet Red liqurice srawberry | Palotes damel sabor fresa |
| Thailand | Arnotts Stikko fingers chocolate wafer sticks | Big Roll Seaweed | Black Pink "venom cream" (Strawberry) Oreos | Big Roll Seaweed | Lush chocolate chewy candy |
| United Kingdom | Hula Hoops Puft Grilled Beef | Sherbert fountain | Sherbert fountain | Sherbert fountain | Sherbert fountain |
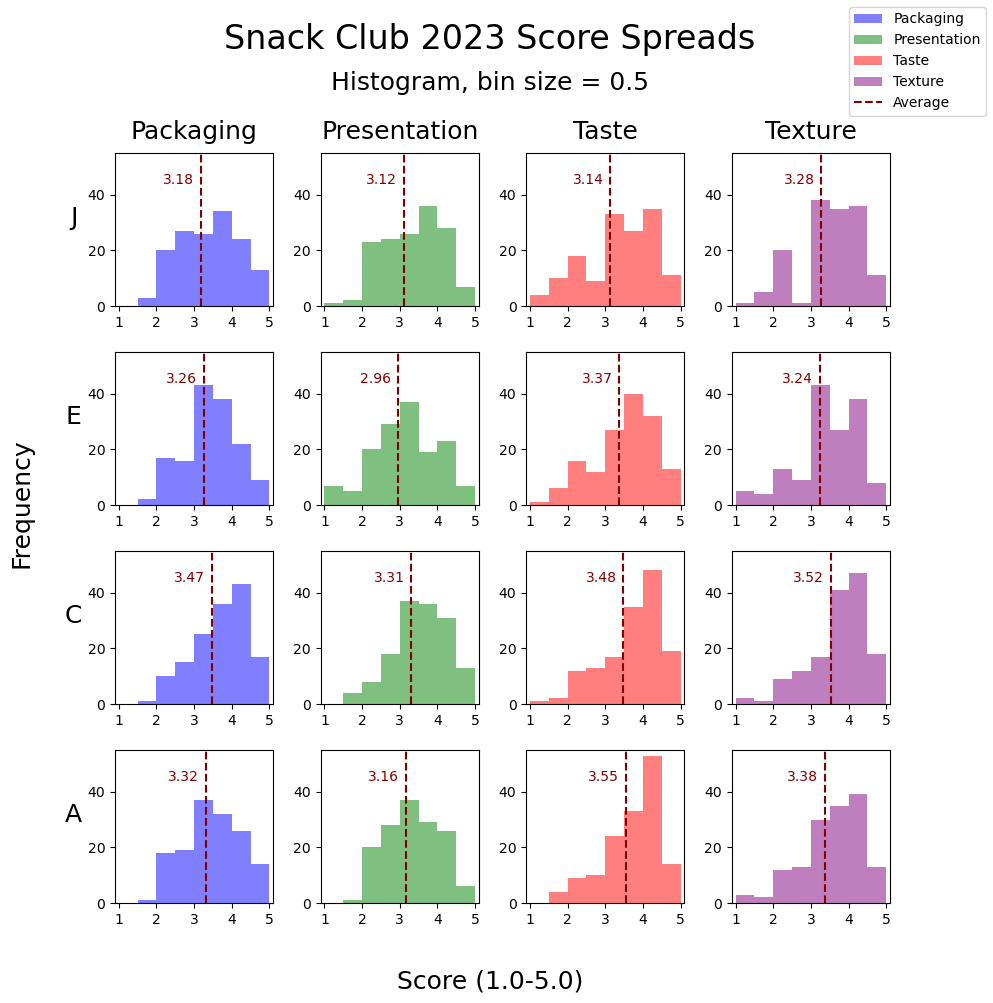
Score Spread, Histograms
Plot histograms to get a sense of the spread of scores given by each members for the four categories. The histogram bin sizes are 0.5.
df_stacked = df.stack().reset_index().rename(columns={'level_4':'Category',
                                        0 : 'Score'})
df_stacked = df_stacked.set_index(['Date','Country','Snack',
                                  'Member','Category'])
# df_stacked = df_stacked.reindex(
#     labels=['Packaging','Presentation','Taste',
#             'Texture','Overall Score'], level='Category')


df_stacked = df_stacked.drop(index='Overall Score',level='Category')
fig, axs = plt.subplots(4,4,figsize=(10,10))
groups1 = ['Member','Category']
groups2 = ['Category']
grouped = df_stacked.groupby(groups1,sort=False)
keys = [x for (x,y) in grouped] # preserves order
targets = zip(keys, axs.flatten())
fig.suptitle('Snack Club 2023 Score Spreads', fontsize=24)
fig.text(0.5,0.92,'Histogram, bin size = 0.5', va='center',ha='center', fontsize=18)
fig.supxlabel('Score (1.0-5.0)', fontsize=18)
fig.supylabel('Frequency', fontsize=18)
colors = {'Packaging':'blue',
          'Presentation':'green',
          'Taste':'red',
          'Texture':'purple'}
by_label = {}
for i, (key, ax) in enumerate(targets):
    j = i%4
    member=key[0]
    category = key[1]
    if i < 4:
        ax.set_title(f"{category}", fontsize=18,
                    pad=10)
    if j == 0:
        ax.set_ylabel(f"{member}", rotation=0, fontsize=18,
                     labelpad=10)
    color = colors[category]
    dfg = grouped.get_group(key)
    dfg = dfg.reset_index(drop=True)
    dfg = dfg.reset_index()
    # display(dfCategory)
    avg = dfg.mean()[1]
    counts, bins = np.histogram(dfg['Score'],range=(0,5.0))
    ax.hist(bins[:-1], bins, weights=counts,
               color=color,label=category,
               alpha=.5)
    ax.axvline(x=avg, color='maroon', linestyle='--',
               label="Average",
               linewidth=1.5)
    ax.set_ylim([0,55])
    ax.set_xlim([0.9,5.1])
    ax.text(avg-1, 44, f'{avg:.2f}', ha='left',color='maroon')
    ax.set_xticks([1,2,3,4,5])
    handles, labels = ax.get_legend_handles_labels()
    by_label.update(dict(zip(labels, handles))) # removes duplicate legends
order = [0,2,3,4,1]
lvals = [x for x in by_label.values()]
lvals = [lvals[idx] for idx in order]
kvals = [x for x in by_label.keys()]
kvals = [kvals[idx] for idx in order]
fig.legend(lvals,kvals , loc='upper right')
fig.subplots_adjust(top=0.85,bottom=0.1, hspace = 0.3, wspace = 0.3)
fig.savefig('plots/sc_2023_histograms.png')
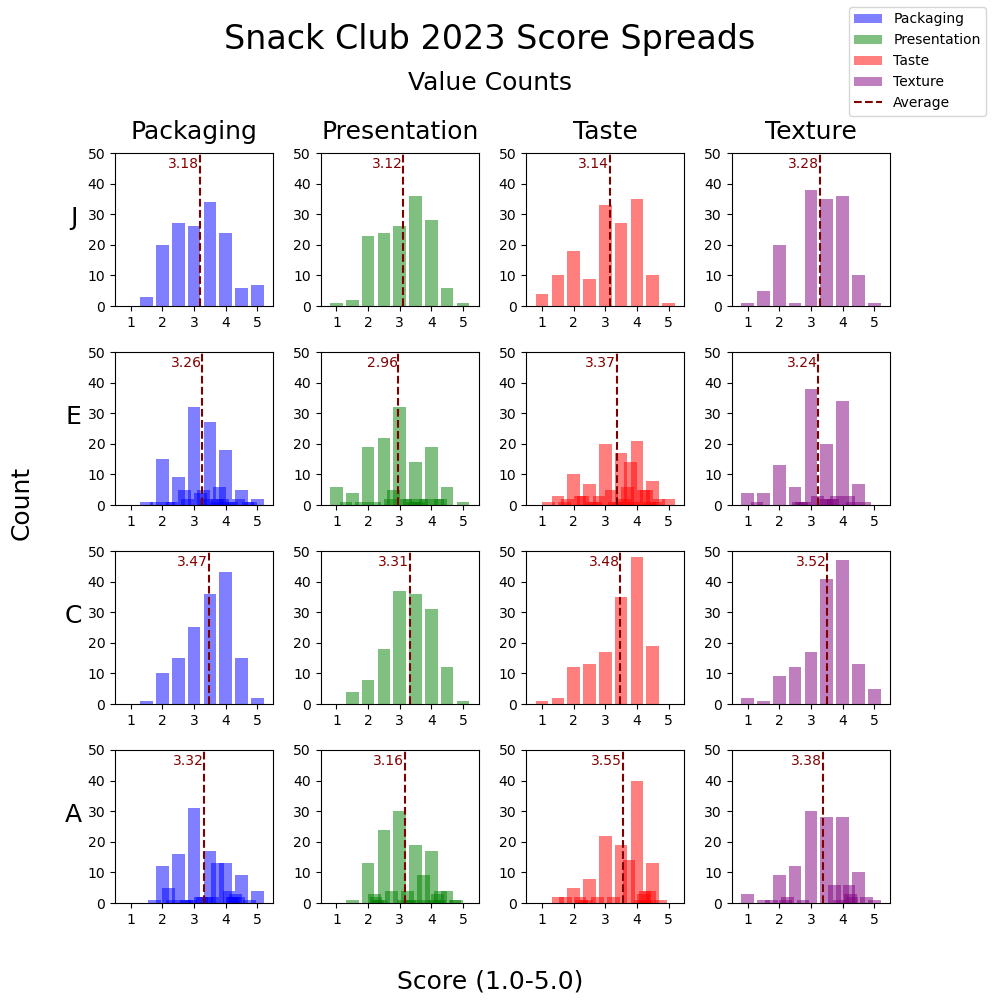
Score Spread, Bar Chart Value Counts
A plot to get a different perspective on score spreads. Instead of a histogram, plot bar charts plotting unique scores counts. This will especially illustrate how some members gave scores in scrict 0.5 intervals and others did not.
import matplotlib.pyplot as plt


df_stacked = df.stack().reset_index().rename(columns={'level_4':'Category',
                                        0 : 'Score'})
df_stacked = df_stacked.set_index(['Date','Country','Snack',
                                  'Member','Category'])
df_stacked = df_stacked.reindex(
    labels=['Packaging','Presentation','Taste',
            'Texture','Overall Score'], level='Category')


df_stacked = df_stacked.drop(index='Overall Score',level='Category')
fig, axs = plt.subplots(4,4,figsize=(10,10))
groups1 = ['Member','Category']
groups2 = ['Category']
grouped = df_stacked.groupby(groups1,sort=False)
keys = [x for (x,y) in grouped] # preserves order
targets = zip(keys, axs.flatten())
fig.suptitle('Snack Club 2023 Score Spreads', fontsize=24)
fig.text(0.5,0.92,'Value Counts', va='center',ha='center', fontsize=18)
fig.supxlabel('Score (1.0-5.0)', fontsize=18)
fig.supylabel('Count', fontsize=18)
colors = {'Packaging':'blue',
          'Presentation':'green',
          'Taste':'red',
          'Texture':'purple'}
by_label = {}
for i, (key, ax) in enumerate(targets):
    j = i%4
    member=key[0]
    category = key[1]
    if i < 4:
        ax.set_title(f"{category}", fontsize=18,
                    pad=10)
    if j == 0:
        ax.set_ylabel(f"{member}", rotation=0, fontsize=18,
                     labelpad=10)
    dfg = grouped.get_group(key)
    dfg = dfg.reset_index(drop=True)
    avg = dfg['Score'].mean()
    dfg = dfg.value_counts().reset_index()
    dfg = dfg.rename(columns={0:'count'})
    # display(dfCategory)
    color = colors[category]
    ax.bar(dfg['Score'],dfg['count'],
               color=color,label=category,
               alpha=.5,width=0.4)
    ax.axvline(x=avg, color='maroon', linestyle='--',
               label="Average",
               linewidth=1.5)
    ax.set_ylim([0,50])
    ax.set_xlim([0.5,5.5])
    ax.set_xticks([1,2,3,4,5])
    ax.text(avg-1, 45, f'{avg:.2f}', ha='left',color='maroon')
    handles, labels = ax.get_legend_handles_labels()
    by_label.update(dict(zip(labels, handles))) # removes duplicate legends
order = [1,2,3,4,0]
lvals = [x for x in by_label.values()]
lvals = [lvals[idx] for idx in order]
kvals = [x for x in by_label.keys()]
kvals = [kvals[idx] for idx in order]
fig.legend(lvals,kvals , loc='upper right')
fig.subplots_adjust(top=0.85,bottom=0.1, hspace = 0.3, wspace = 0.3)
fig.savefig('plots/sc_2023_bar_vcs.png')
Number of unique scores
After seeing the last plots, now interested to see number of unique scores given by member.
display('# Unique scores')
display(df_stacked.groupby('Member').apply(lambda x: x.value_counts().shape[0]).sort_values())
'# Unique scores'


Member
C     9
J     9
A    33
E    33
dtype: int64
Ones, Fives, Below 3
Trying to dig into score spreads some more. Looking at the number of 1 and 5 scores given, the lowest and highest score possible. Also, looking at number of scores which were less than 3. Either of these metrics could indicate some how critical or not a member is, e.g., a low number of ~5 scores given means a rater who is rarely impressed.
def custom_round(x, base=5):
    return round(base * round(float(x)/base),2)

df_thresh = pd.DataFrame()
df_thresh['Score'] = df_stacked['Score']
df_thresh['Score Round 0.5'] = df_stacked['Score'].apply(lambda x: custom_round(x,base=0.5))
df_thresh['Score Rounded == 1'] = df_thresh[['Score Round 0.5']] == 1
# display(df_thresh.loc[df_thresh['Score Rounded == 1'] == True])
df_thresh['Score Rounded == 5'] = df_thresh[['Score Round 0.5']] == 5

df_thresh['Score Rounded < 3'] = df_thresh[['Score Round 0.5']] < 3
# display(df_thresh.loc[df_thresh['Score Rounded == 5'] == True])
# df_thresh['Score, around 2.5'] = (df_stacked[['Score']] > 2.25) & (df_stacked[['Score']] < 2.75)
# display(df_thresh)

for gs in [['Member'],['Category'],['Category','Member']]:
    df_thresh_mc = pd.DataFrame()
    df_thresh_mc['# Score'] = df_thresh['Score Rounded == 1'].groupby(gs).apply(lambda x: x.count())
    df_thresh_mc['# Score Rounded == 1'] = df_thresh['Score Rounded == 1'].groupby(gs).apply(sum)
    df_thresh_mc['# Score Rounded == 5'] = df_thresh['Score Rounded == 5'].groupby(gs).apply(sum)
    df_thresh_mc['# Score Rounded < 3'] = df_thresh['Score Rounded < 3'].groupby(gs).apply(sum)
    display(df_thresh_mc)
| # Score | # Score Rounded == 1 | # Score Rounded == 5 | # Score Rounded < 3 | |
|---|---|---|---|---|
| Member | ||||
| A | 588 | 3 | 11 | 131 |
| C | 588 | 3 | 8 | 108 |
| E | 588 | 11 | 6 | 151 |
| J | 588 | 6 | 10 | 168 |
| # Score | # Score Rounded == 1 | # Score Rounded == 5 | # Score Rounded < 3 | |
|---|---|---|---|---|
| Category | ||||
| Packaging | 588 | 0 | 17 | 145 |
| Presentation | 588 | 7 | 5 | 181 |
| Taste | 588 | 6 | 4 | 122 |
| Texture | 588 | 10 | 9 | 110 |
| # Score | # Score Rounded == 1 | # Score Rounded == 5 | # Score Rounded < 3 | ||
|---|---|---|---|---|---|
| Category | Member | ||||
| Packaging | A | 147 | 0 | 5 | 36 |
| C | 147 | 0 | 2 | 26 | |
| E | 147 | 0 | 3 | 33 | |
| J | 147 | 0 | 7 | 50 | |
| Presentation | A | 147 | 0 | 2 | 45 |
| C | 147 | 0 | 1 | 30 | |
| E | 147 | 6 | 1 | 56 | |
| J | 147 | 1 | 1 | 50 | |
| Taste | A | 147 | 0 | 1 | 21 |
| C | 147 | 1 | 0 | 28 | |
| E | 147 | 1 | 2 | 32 | |
| J | 147 | 4 | 1 | 41 | |
| Texture | A | 147 | 3 | 3 | 29 |
| C | 147 | 2 | 5 | 24 | |
| E | 147 | 4 | 0 | 30 | |
| J | 147 | 1 | 1 | 27 |
Score Similarity
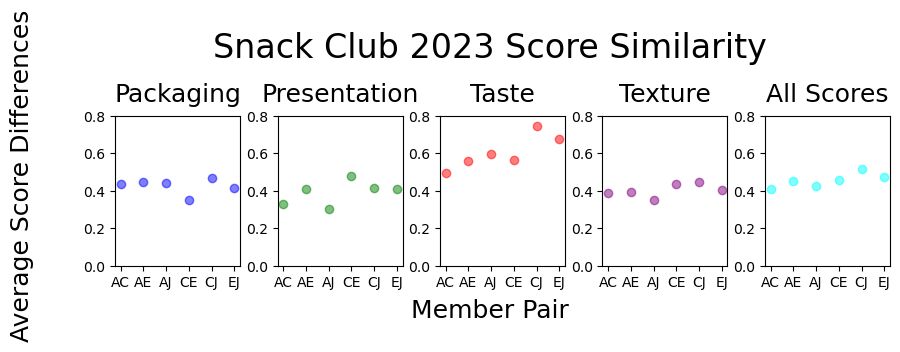
This is looking at how similar member scores are. Basically, for ever combination of two members, calculate the difference between the scores and average them by category. For example, the highest average difference in the table directly below is 0.74 for the taste category between members C and J. This means these two members, relatively speaking at least, had the most opposing tastes in snacks. Note that I could maybe make this better by rounding all scores to nearest 0.5 interval.
import itertools
df
df_stacked = df_stacked.drop(index='Overall Score',level='Category')
df_m = df_stacked.unstack(level=-2)
df_m.columns = df_m.columns.droplevel()
# is there an easier way to do this? lol
combo = list(itertools.combinations(df_m.columns, 2))
for c in combo:
    c_str = c[0] + c[1]
    df_m[c_str] = abs(df_m[c[0]] - df_m[c[1]])

df_dif = df_m.drop(columns=['A','C','E','J'])

# by category
df_dif_mean = df_dif.groupby('Category').mean()

# All scores
df_dif_mean_all = df_dif.mean().to_frame().T
df_dif_mean_all = df_dif_mean_all.rename(columns={0:'Average Difference, All Scores'})
df_dif_mean_all = pd.concat([df_dif_mean, df_dif_mean_all])
df_dif_mean_all = df_dif_mean_all.rename({0 : 'All Scores'})
df_dif_mean_all = df_dif_mean_all.T
df_dif_mean_all
| Packaging | Presentation | Taste | Texture | All Scores | |
|---|---|---|---|---|---|
| Member | |||||
| AC | 0.43 | 0.33 | 0.49 | 0.39 | 0.41 |
| AE | 0.45 | 0.41 | 0.56 | 0.39 | 0.45 |
| AJ | 0.44 | 0.30 | 0.60 | 0.35 | 0.42 |
| CE | 0.35 | 0.48 | 0.56 | 0.44 | 0.46 |
| CJ | 0.47 | 0.41 | 0.74 | 0.45 | 0.52 |
| EJ | 0.41 | 0.41 | 0.68 | 0.40 | 0.47 |
Now looking at member score differences by snack. Just looking at a sample of three high/low differences, because there could be many that are the same. “We really agreed on these snacks” vs “We really disagreed on these snacks”
# by snack
idx = pd.IndexSlice
df_dif_taste = df_dif.unstack('Category').loc[:, idx[:, ['Taste']]].droplevel(axis='columns',level=1)
df_dif_taste_max = df_dif_taste.agg(['idxmax']).applymap(lambda x: x[2])
d_dif_taste_m = df_dif_taste.T.droplevel(axis='columns',level=[0,1]).unstack().to_frame()
d_dif_taste_m = d_dif_taste_m.reset_index().set_index(['Member','Snack']).sort_values(by=[0],ascending=False)
display(d_dif_taste_m.reorder_levels([1,0]).groupby('Member').apply(lambda x: x[-4:-1]).droplevel(axis='rows',level=2).rename(columns={0:'Taste Score Least Diff (Sample 3)'}))
display(d_dif_taste_m.reorder_levels([1,0]).groupby('Member').apply(lambda x: x[0:3]).droplevel(axis='rows',level=2).rename(columns={0:'Taste Score Most Diff (Sample 3)'}))
| Taste Score Least Diff (Sample 3) | ||
|---|---|---|
| Member | Snack | |
| AC | Hard MtnbDew Baja Blast Zero Sugar | 0.0 |
| Oishi Orange Candy | 0.0 | |
| Croccantelle susto Pizza | 0.0 | |
| AE | Chokis Chocobase cookies | 0.0 |
| Yoyo Cola Jelly Pieces | 0.0 | |
| Loacker Classic Cocoa & Milk Wafer | 0.0 | |
| AJ | Swizzlers Refreshers Lemon Flavor | 0.0 |
| Hard MtnbDew Baja Blast Zero Sugar | 0.0 | |
| Cleeves Original Toffee | 0.0 | |
| CE | Buondi Motta Cioccolato cake | 0.0 |
| Cabury BOOST | 0.0 | |
| Manora Fried Pumpkin Chips | 0.0 | |
| CJ | Cleeves Original Toffee | 0.0 |
| Rap Snacks Rick Ross Sweet Chilli Lemon Pepper | 0.0 | |
| Rap Snacks Lily Baby "All In" Flavor Salt & Vinegar, BBQ, Onion, garlic, and more | 0.0 | |
| EJ | Buondi Motta Cioccolato cake | 0.0 |
| Cadbury Snack! shortcake | 0.0 | |
| Rap Snacks Lily Baby "All In" Flavor Salt & Vinegar, BBQ, Onion, garlic, and more | 0.0 |
| Taste Score Most Diff (Sample 3) | ||
|---|---|---|
| Member | Snack | |
| AC | Parle kismi candy | 2.00 |
| Pocky Sumer Paradise Peach Lychee & Elderflower | 2.00 | |
| Jaffa Cakes "The Original" | 2.00 | |
| AE | Big Roll Seaweed | 2.90 |
| Bear Paws Pattes d'ours | 2.50 | |
| Big Sheet Seaweed Spicy | 2.50 | |
| AJ | Cadbury crunchie chocolate bar | 2.50 |
| Chokis Chocolatoasas y Deliciosass | 2.25 | |
| KitKat Chunky (with french on it) | 2.00 | |
| CE | Cheetos Masala Balls | 2.50 |
| Big Sheet Seaweed Spicy | 2.50 | |
| Ruffles "All Dressed" | 2.20 | |
| CJ | Parle kismi candy | 3.00 |
| Lacta Oreo Bar | 3.00 | |
| Cadbury crunchie chocolate bar | 3.00 | |
| EJ | Cabury Fudge | 3.00 |
| Big Roll Seaweed | 3.00 | |
| Cucumber Lays | 2.80 |
This plot visualizes the results described above. Especially interesting is how the taste scores are mostly higher than the other categories, an indicator perhaps that we give taste the most critical and independent thought. The table at the bottom looks at this by snack and shows the ten which could be considered the most “looked better than it tasted”.
fig, axs = plt.subplots(1,5,figsize=(10,3))
fig.suptitle('Snack Club 2023 Score Similarity', fontsize=24)
fig.supxlabel('Member Pair', fontsize=18)
fig.supylabel('Average Score Differences', fontsize=18)

keys = df_dif_mean_all.columns # preserves order
targets = zip(keys, axs.flatten())
colors = ['blue','green','red','purple','cyan']
for i, (key, ax) in enumerate(targets):
    dfg = df_dif_mean_all[[key]]
    dfg = dfg.reset_index().reset_index()
    color = colors[i]
    dfg.columns = ['index','Member Pair', 'Average Difference']
    ax.scatter(dfg['Member Pair'],dfg['Average Difference'],
               color=color,
               label=key,
               alpha=.5)
    ax.set_ylim([0,0.8])
    ax.set_title(f"{key}", fontsize=18,
                    pad=10)
fig.subplots_adjust(top=0.7,bottom=0.2, hspace = 0.3, wspace = 0.3)
fig.savefig('plots/sc_2023_score_sim.png')
Tasted Better/Worst Than Looked
Trying to get a sense of which members tended to think a snack tasted better/worst than it looked.
df_tp = pd.DataFrame()
df_tp['Taste - Pres.'] = df['Taste'] - df['Presentation']
df_tp['Taste < Pres.'] = df['Taste'] < df['Presentation']
display(df_tp['Taste - Pres.'].groupby('Member').mean().rename('Taste and Presentation Difference, Average').to_frame())
display('****************************************')
display(df_tp['Taste < Pres.'].groupby('Member').apply(lambda x: f"{x.sum()/x.size*100:.1f}" +'%').rename('Tasted Worst Than Looked (%)').to_frame())
display('****************************************')
display(df_tp['Taste - Pres.'].groupby('Snack').mean().sort_values().rename('Taste and Presentation Difference (avg by memb.), Top 10')[0:10].to_frame())
| Taste and Presentation Difference, Average | |
|---|---|
| Member | |
| A | 0.38 |
| C | 0.17 |
| E | 0.41 |
| J | 0.02 |
'****************************************'
| Tasted Worst Than Looked (%) | |
|---|---|
| Member | |
| A | 22.4% |
| C | 29.9% |
| E | 30.6% |
| J | 35.4% |
'****************************************'
| Taste and Presentation Difference (avg by memb.), Top 10 | |
|---|---|
| Snack | |
| Oreo Oolong + Peach | -1.70 |
| Keraso Pitaki cherry pie | -1.64 |
| Rowntrees Random fruit snacks | -1.44 |
| Old Dutch Ketchup Flavored Potatoe Chips | -1.36 |
| Croky Bicky flavor Chips | -1.32 |
| Rap Snacks Lily Baby "All In" Flavor Salt & Vinegar, BBQ, Onion, garlic, and more | -1.25 |
| Choclitos Limon chips | -1.15 |
| Lacta Oreo Bar | -1.06 |
| DeliChoc Choco'Bar | -1.05 |
| Treat Burst Choco Fills | -1.00 |